Net Zero Roadmap
Scope 1 & 2 Net Zero Roadmap
In 2022, SK bioscience conducted an analysis of greenhouse gas emissions across all of its worksites based on methodologies proposed by the Science Based Targets initiatives (SBTi). The Company then publicly announced its first mid- to long-term roadmap targeting Net Zero by 2031.
Scope 1 emissions primarily result from the use of LNG fuel in the boilers at the Andong L HOUSE. SK bioscience aims to promote green fuel switching in line with the government’s policy of promoting and expanding hydrogen infrastructure. Scope 2 emissions mainly arise from electricity consumption. SK bioscience signed a renewable PPA (Power Purchase Agreement) in 2024, with the goal of sourcing renewable energy from 2027.
The Company is currently recalculating its Business As Usual (BAU) emissions to reflect the inclusion of the Andong L HOUSE expansion and the Global R&PD Center within its greenhouse gas reporting boundaries. In line with this, the Net Zero roadmap is being further refined, and the updated version will be transparently disclosed in the near future.
- 1)PPA (Power Purchase Agreement): Contract for Electricity Purchase
2031 Net Zero Roadmap
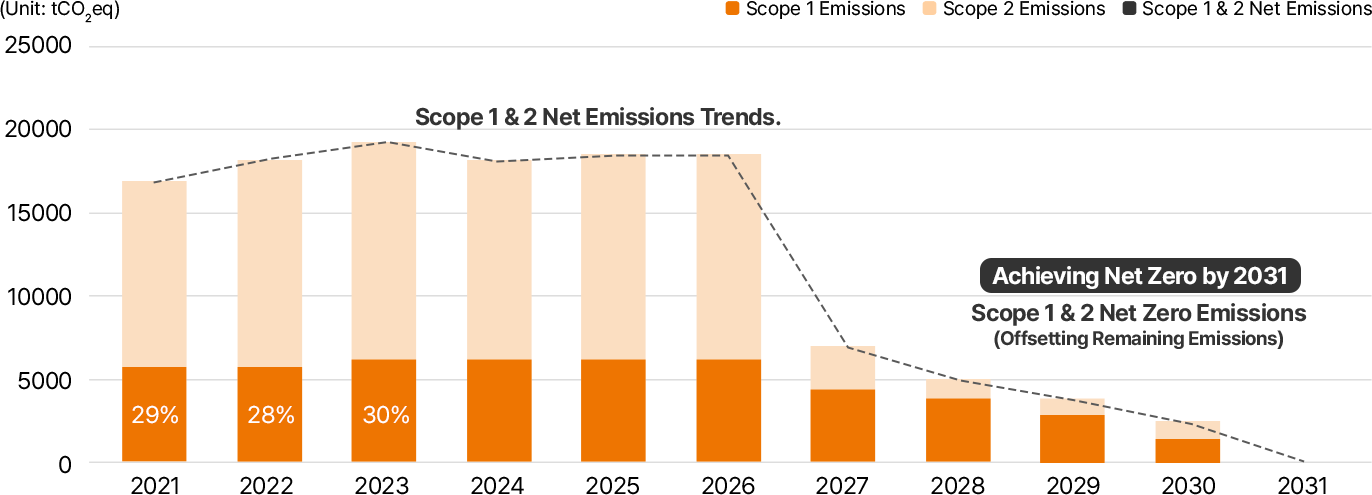
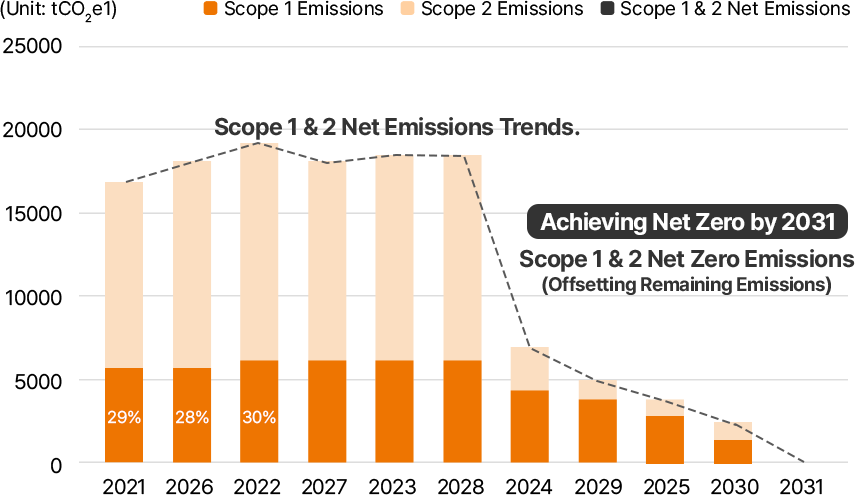
(단위: tCO2eq)
- 2021년 Scope1배출량:29% , Scope 2 배출량:16000 , Scope 1,2 배출량:
- 2022년 Scope1배출량:28% , Scope 2 배출량:18000, Scope 1,2 배출량:
- 2023년 Scope1배출량:30% , Scope 2 배출량:19000, Scope 1,2 배출량:
- 2024년 Scope1배출량: , Scope 2 배출량:18000, Scope 1,2 배출량:
- 2025년 Scope1배출량: , Scope 2 배출량:18000, Scope 1,2 배출량:
- 2026년 Scope1배출량: , Scope 2 배출량:18000, Scope 1,2 배출량:
- 2027년 Scope1배출량: , Scope 2 배출량:7000, Scope 1,2 배출량:
- 2028년 Scope1배출량: , Scope 2 배출량:5000, Scope 1,2 배출량:
- 2029년 Scope1배출량: , Scope 2 배출량:4000, Scope 1,2 배출량:
- 2030년 Scope1배출량: , Scope 2 배출량:3000, Scope 1,2 배출량:
- 2031년 Scope1배출량:0 , Scope 2 배출량:0, Scope 1,2 배출량:0
- ※Post-2025 emissions may vary depending on the expansion/operation of Andong L HOUSE and Songdo R&PD Center.
Scope 1 & 2 Net Zero Scenario
Direct GHG Emissions (Scope 1)
Hydrogen Energy Transition Scenario
Scope 1 stationary combustion emissions account for 29% of the total emissions, with over 97% originating from LNG boilers at the Andong L HOUSE. Hydrogen energy is gaining attention as a clean energy source. However, market stability in terms of supply, demand, government policies, and infrastructure will take time to achieve. Accordingly, SK bioscience plans to continuously monitor hydrogen-related regulations and pricing in the short to mid-term and gradually replace its boilers with hydrogen co-firing or full hydrogen boilers.
Indirect GHG Emissions (Scope 2)
Renewable Energy Transition Scenario
Approximately 71% of SK bioscience's greenhouse gas emissions fall under Scope 2, with 98% of these emissions originating from electricity usage. Therefore, transitioning from traditional fossil fuel-based power sources to renewable energy is central to the Company's Net Zero strategy. SK bioscience plans to secure renewable energy through a PPA (Power Purchase Agreement) and will continuously monitor and adjust for anticipated emissions changes due to the operational environments of facilities such as Andong L HOUSE and Songdo Global R&PD Center. We remain committed to flexibly responding to climate change risks amid rapidly evolving domestic and international business environment.
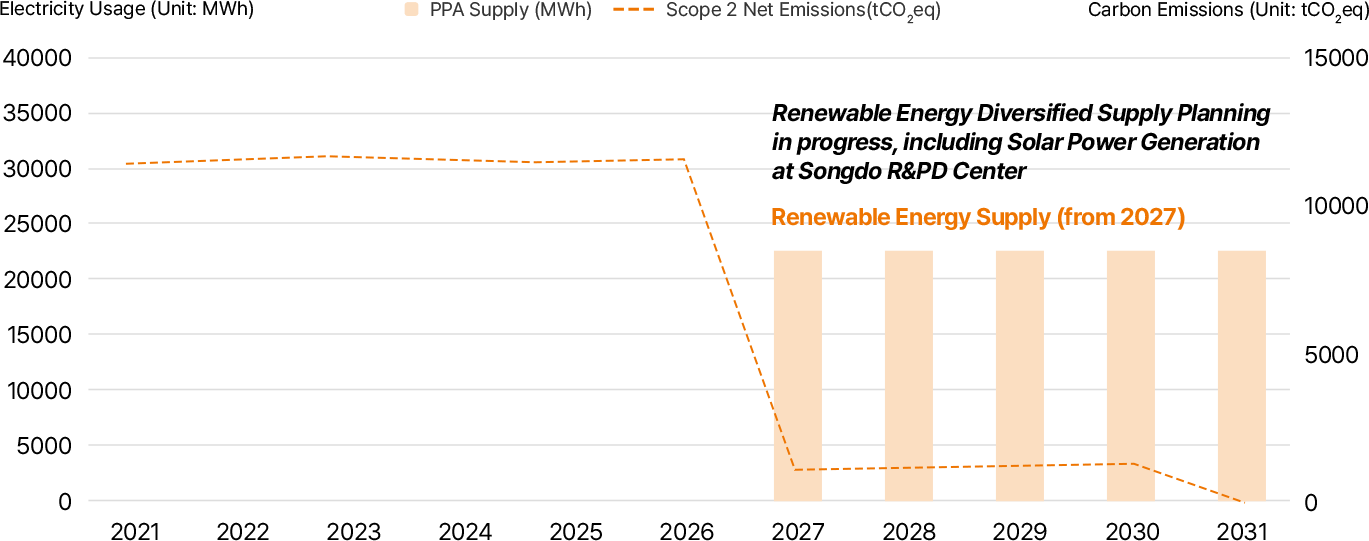
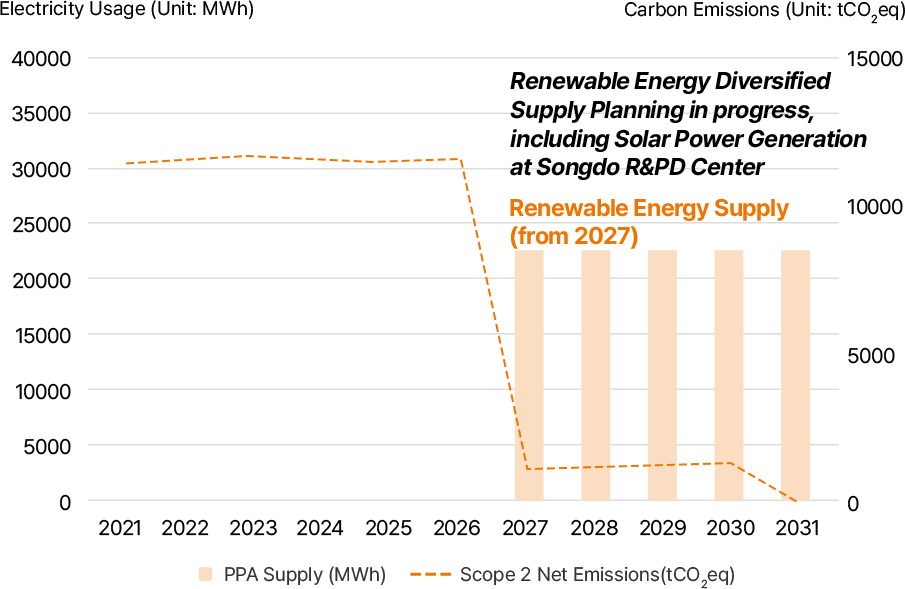
전력 사용량 (단위: MWh), 탄소배출량 (단위: tCO2eq)
- 2021년 Scope 2 순배출량 (tCO2eq): , PPA 공급량 (MWh):
- 2022년 Scope 2 순배출량 (tCO2eq): , PPA 공급량 (MWh):
- 2023년 Scope 2 순배출량 (tCO2eq): , PPA 공급량 (MWh):
- 2024년 Scope 2 순배출량 (tCO2eq): , PPA 공급량 (MWh):
- 2025년 Scope 2 순배출량 (tCO2eq): , PPA 공급량 (MWh):
- 2026년 Scope 2 순배출량 (tCO2eq): , PPA 공급량 (MWh):
- 2027년 Scope 2 순배출량 (tCO2eq): , PPA 공급량 (MWh):
- 2028년 Scope 2 순배출량 (tCO2eq): , PPA 공급량 (MWh):
- 2029년 Scope 2 순배출량 (tCO2eq): , PPA 공급량 (MWh):
- 2030년 Scope 2 순배출량 (tCO2eq): , PPA 공급량 (MWh):
- 2031년 Scope 2 순배출량 (tCO2eq): 0, PPA 공급량 (MWh): 0
Financial Impact Analysis According to Net Zero Scenario
SK bioscience signed a long-term supply contract for 20 MW of renewable energy per year in 2024 and will procure solar power for L HOUSE in Andong from 2027 to 2046.
Accordingly, we categorize rising industrial electricity prices and increased operating expenses due to procurement of renewable energy as transition risks/opportunities and regularly monitor the trend of electricity price changes and their financial impact annually. As of the first half of 2025, the transition cost associated with renewable energy supply (20MW) is expected to account for approximately KRW 3 billion per year on average in total electricity costs starting from 2027.
SK bioscience will publicly disclose an updated Net Zero roadmap given the expansion of our worksites. Also, we will regularly monitor and transparently disclose the financial impact of Net Zero implementation.
Governance
Management & Supervision of the Board of Directors
SK bioscience’s top decision-making bodies, namely the Board of Directors and the ESG Committee, are responsible for issues concerning climate change response strategies and activities. The Board holds the responsibility for managing and supervising all ESG management factors, including climate change. The ESG Committee evaluates risks and opportunities, assesses ESG management performance, and monitors and reports the implementation progress of climate change responses to the Board. Furthermore, the Board secures climate change leadership by integrating ESG performance into the CEO’s key performance indicators (KPIs) and compensation system.
Roles of Executives
SK bioscience operates an ESG Council to respond to major company-wide risks. The ESG Council makes decisions on key issues such as greenhouse gas reduction measures and investment activities, in addition to management strategies to respond to climate change. It also regularly monitors the activities of the departments in this regard, including strategy and risk management. Furthermore, SK bioscience operates ESG Working-level Council to support the decision-making process of the Board of Directors and ESG Committee and enhance the working-level collaboration.
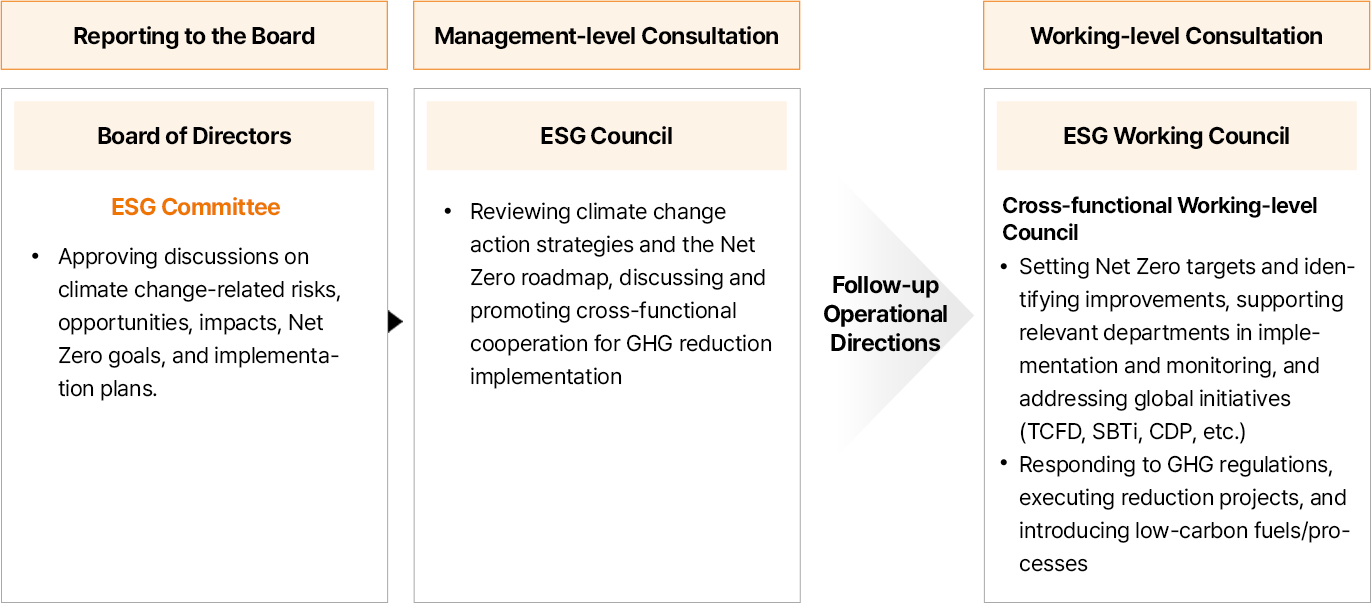
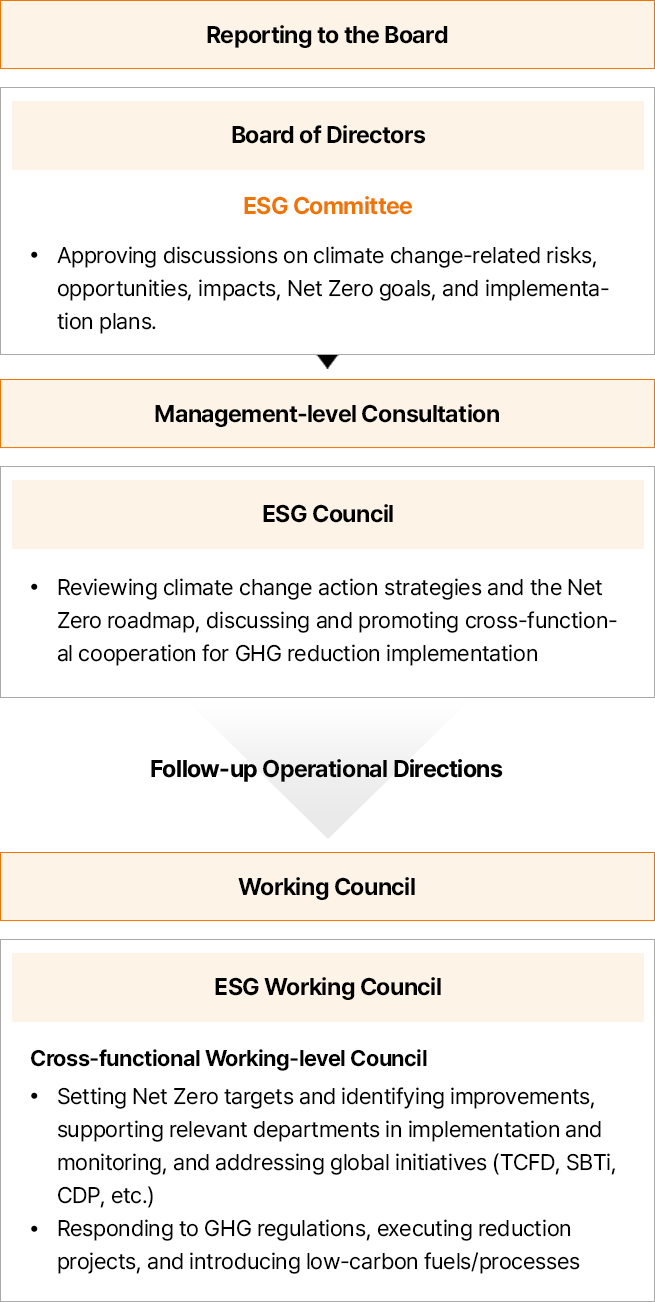
Climate Change Response Implementation Framework
-
- 이사회 보고
- Board of Directors
- ESG위원회
- 기후변화 관련 리스크 및 기회와 영향도 검토, Net Zero 목표 및 추진계획 논의 및 승인
-
- 경영층 회의체
- ESG 협의체
- 기후변화 대응 전략 및 Net Zero 로드맵 검토, 온실가스 감축 이행을 위한 전사 협력 촉진 등
- 향후 운영 방향
-
- 실무 회의체
- ESG 실무협의체
- 전사 조직 간 실무협의체
- Net Zero 목표 수립 및 개선과저 도출, 유관부서 실행 지원 및 이행점검, 글로벌 이니셔티브 (TCFD, SBTi, CDP 등) 대응
- 온실가스 규제 대응 및 감축과제 이행, 저탄소 연료/공정 도입 등
Board Oversight of Climate Change Agenda
| Category | Date | Agenda (Content) |
|---|---|---|
| Board of Directors | April 24, 2024 | Proposal for SK Group-wide renewable energy joint PPA (Power Purchase Agreement) |
| November 23, 2022 | Report on progress in climate change response | |
| October 26, 2022 | Publication of TCFD Report | |
| July 27, 2022 | Update on progress in climate change response | |
| ESG Committee | April 17, 2024 | Proposal for SK Group-wide renewable energy joint PPA (Power Purchase Agreement) |
| April 17, 2023 | Implementation of RE100 initiative | |
| October 13, 2022 | Publication of TCFD report | |
| July 20, 2022 | Report on progress in climate change response |
Strategy
Net Zero Operation – Short- & Mid-term Strategy to Achieve Net Zero at Worksites
SK bioscience has set a GHG Net Zero goal and developed a roadmap in alignment with the Science Based Targets initiative (SBTi). In addition, we have identified GHG emissions by major sources at worksites through voluntary GHG verification since 2021 and have established strategies for fuel switching and RE100 adoption to refine the Net Zero goal. At the same time, we have analyzed the economic feasibility of Net Zero costs to enhance the strategy implementation. We will also refine and update the Net Zero roadmap accounting for changes in reporting boundaries and publish it accordingly.
Net Zero in Value Chain – Long-term Strategy to Respond to Climate Change
SK bioscience has completed the calculation of Scope 3 emissions for 2022 in order to plan reduction activities throughout the entire value chain. We plan to respond in stages by identifying the amount of GHG emissions in major categories. To achieve Scope 3 Net Zero, we will implement a gradual reduction strategy, starting with the conversion of internal and external fleet to electric vehicles in the short term. Additionally, we will collect product LCA data and up/downstream emissions database.
Worksite Net Zero Roadmap
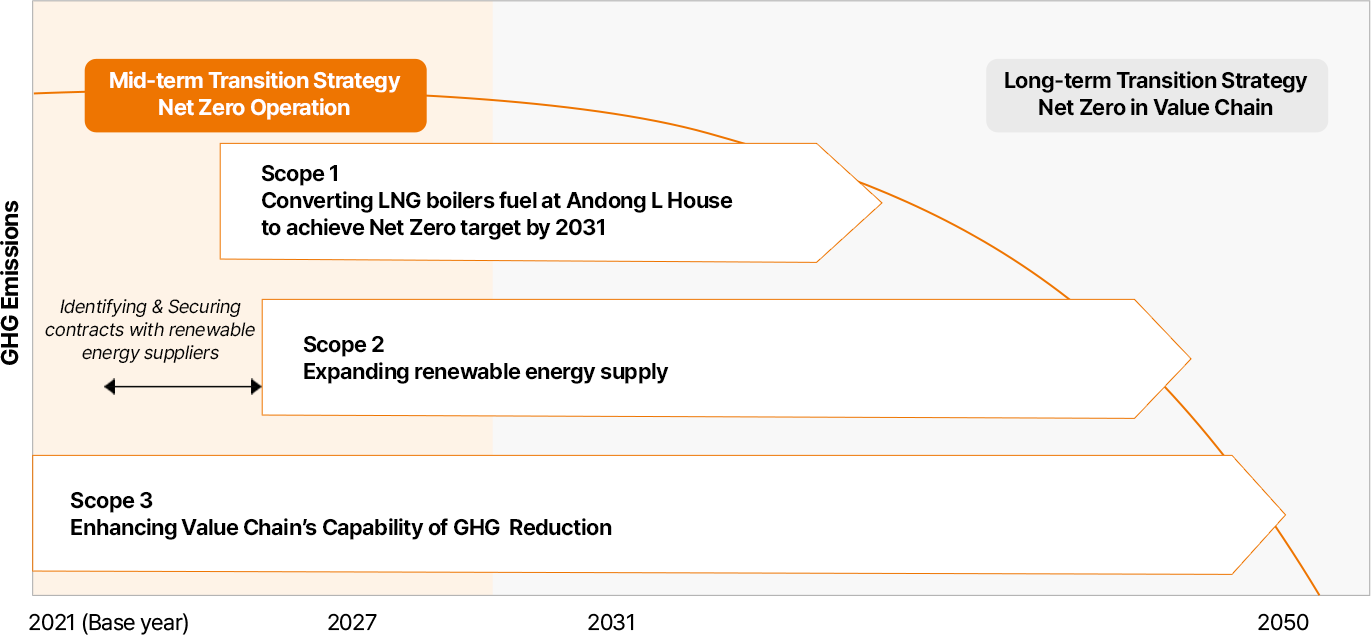
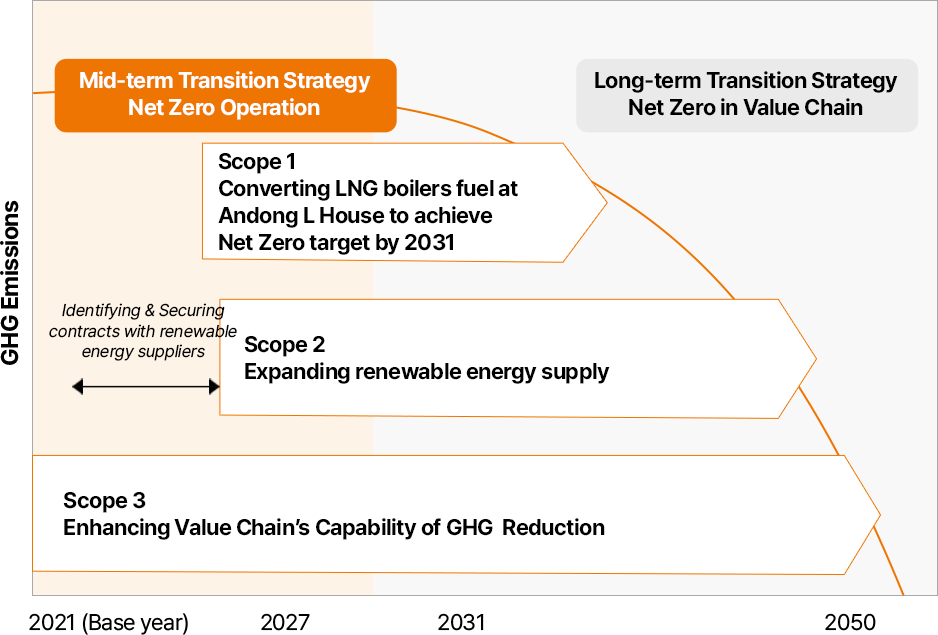
- 2021~2050년 : Scope 3 Value Chain 온실가스 감축 역량 강화
- 2025~2030년 : Scope 2 재생에너지 공급 및 확대, 재생에너지 공급사 모색 및 계약 체결
- 2024~2031년 : Scope 1 안동 L HOUSE LNG 보일러 연료 전환 Net Zero 목표 달성 (2031)
Assessment of Climate Change Risks & Opportunities
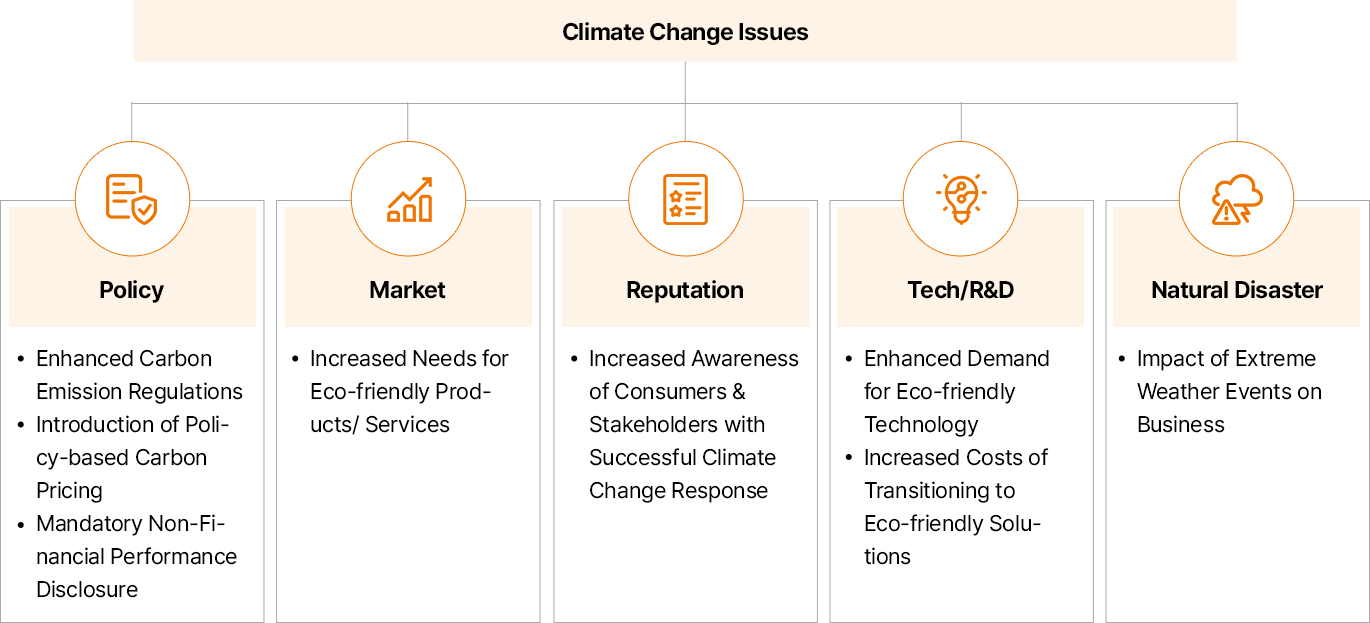
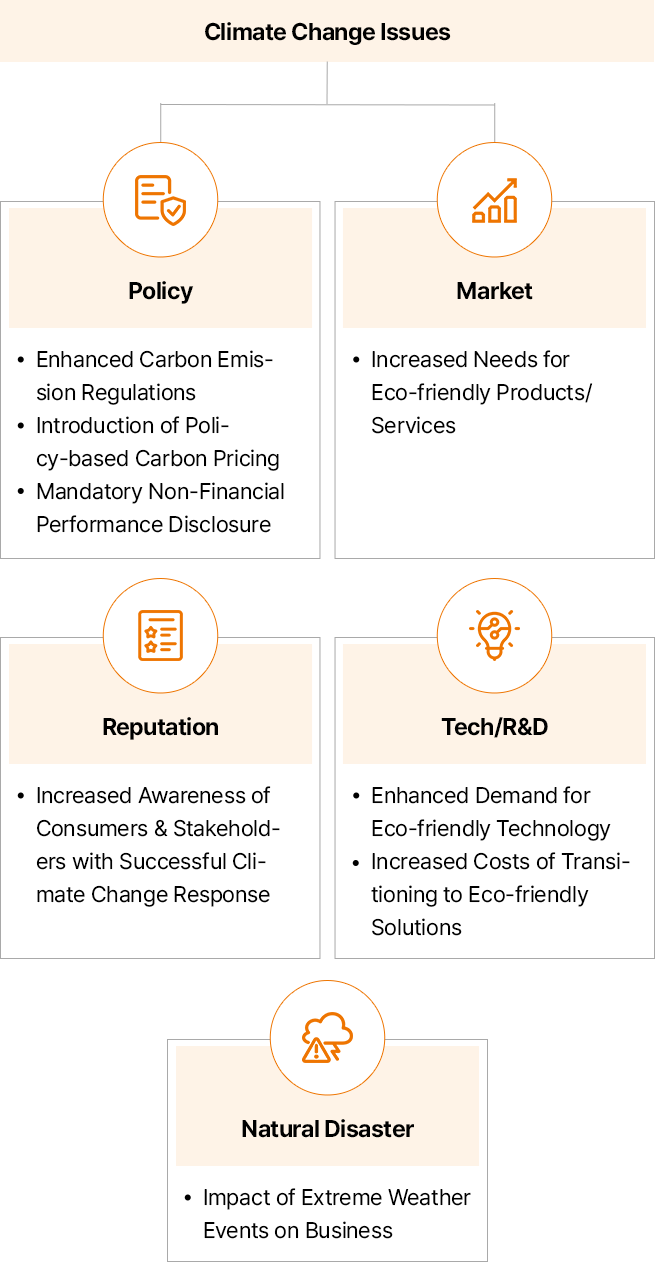
In line with the 2022 TCFD’s recommendations, SK bioscience has identified risks and opportunities that affect the sustainability of its business and future response to climate change. At the policy level, the strengthening of carbon emission regulations and the introduction of carbon pricing act as drivers to accelerate corporate carbon reduction efforts. Additionally, the trend of mandating non-financial performance disclosure is promoting transparent reporting of carbon reduction performance.
In the market, growing demand for green products and services is driving a premium for low- and zero-carbon products. From a reputation perspective, we anticipate that an organization’s brand image will soon be influenced by its climate change response performance, highlighting the importance of relevant R&D and technological capabilities. We also expect that extreme weather events will impact business operations and assets.
Climate Change Factors
기후변화 이슈
-
- 정책
- 탄소 배출 규제 강화
- 정책적 탄소 가격 도입
- 비재무 성과 공시 의무화
-
- 시장
- 친환경 제품/서비스 니즈 증가
-
- 평판
- 기후변화 대응 성과에 따른 소비자 및 이해관계자의 인식 향상
-
- 기술/R&D
- 친환경 기술 요구 강화
- 친환경 전환 비용 증가
-
- 자연재해
- 이상기후 현상에 따른 사업 영향
Climate Change Risks & Opportunities
Climate change brings about various risks and opportunities that can directly or indirectly impact our financial and non-financial performance. Recognizing the significance of climate change on our business, SK bioscience has categorized these risks into transition risks and physical risks, and conducted risks and opportunities assessments. Building upon the evaluation outcomes, we plan to consistently manage the impacts of climate change.
| Category | Climate Change Issues | Risks | Opportunities | Our Approach | |
|---|---|---|---|---|---|
| Transition Risks & Opportunities | Policy/Law | Introduction of carbon tax/Regulations on carbon emissions |
|
|
|
| Increasing trend of disclosing climate change action status |
|
|
|
||
| Market | Growing global needs for sustainable life sciences |
|
|
|
|
| Increasing possibility of receiving negative feedback from stakeholders and rising social costs |
|
|
|
||
| Reputation | Increasing trend of disclosing climate change action status |
|
|
||
| Stakeholders’ perception of climate change response performance and communication |
|
|
|
||
| Technology | Increased demand for technologies that reduce environmental impacts and rising cost for low-carbon transition |
|
|
|
|
| Category | Climate Change Issues | Risks | Our Approach | |
|---|---|---|---|---|
| Physical Risks | Acute | Heat wave |
|
|
| Wildfire |
|
|
||
| Typhoon |
|
|||
| Torrential downpour |
|
|||
| Chronic | Increased extreme weather events |
|
|
|
| Average temperature increase |
|
|
||
Risk Management
Climate Change Risk Management System
To manage climate change risks that have a direct or indirect impact on both financial and non-financial performance, SK bioscience conducts evaluations of potential climate-related risks. These evaluations take into account the timeframe (short-, mid-, and long-term), and financial impact. The ESG Team collaborates with relevant departments to identify and assess climate-related issues, and subsequently reports them to the management. The management incorporates the identified risks and opportunities, along with their actual and potential impact, into their decision-making process. The risk management system reflects domestic and international climate change policy objectives, Net Zero goals and achievements, and the level of exposure to climate risks. The key findings are then reported to both the ESG Committee and the Board of Directors.
The ESG Committee is systematically monitoring climate change risks and opportunities, and we plan to internalize climate change risk management into the integrated financial and non-financial risk management and reporting framework. Accordingly, we will minimize negative risks from climate change by identifying potential impacts on the entire Company in the event of severe climate change risks and proposing countermeasures.
Climate Change Risk Management Process
1. Identifying Climate-related Risks
- Reporting to the Board on business and operational risks associated with climate risks through the ESG Committee
- Identifying and reporting risks to management and the Board from business units and the ESG Team to incorporate climate risk into future new business and investments.
2. Evaluating Climate-related Risks
- The ESG Team: evaluating investment and business risks in consideration of the criteria for climate-related risks(scale, operation, capability, willingness to mitigate risks, etc.)
- The range of evaluation can be adjusted based on the characteristics of the biotech sector, operation, transaction characteristics and scale. The evaluation result determines the metrics.
3. Risk Management Activity
- Implementing policies to manage risks by business area, collecting and analyzing data, including GHG emissions
- Disclosing climate-related risks and conducting external verification of the accuracy, clarity, comparability, and timeliness of the information
- Reducing manageable risk exposures of climate-related metrics, determining targets that can be improved
4. Result Reporting
- The ESG Team: Reporting on risk exposure levels, metrics, and level of target achievement
- Investment and business projects with high climate risks should be approved by the CEO and involve consultation with external experts. Employees regularly review and work towards improving the management practices with project managers, aiming to transition towards a sustainable business.
Metrics & Targets
Net Zero Targets Implementation
SK bioscience aims to reduce greenhouse gas emissions by introducing and expanding the use of renewable energy in the mid- to long-term. The Company will gradually enlarge renewable energy usage at worksites such as through the staged conversion of LNG fuel to hydrogen for the Andong L HOUSE multitube-through boilers and the supply of solar-generated electricity, and redefine goals and strategies as our reporting boundaries have been expanded.
| Category | Unit | 2023 | 2024 | 2025 | 2026 | 2027 | 2028 | 2029 | 2030 | 2031 | Target Year | |
|---|---|---|---|---|---|---|---|---|---|---|---|---|
| Net Zero Targets Response | Scope 1 Reduction Rate | % | 0 | 0 | 0 | 10 | 10 | 20 | 30 | 50 | 100 | 2031 |
| Scope 2 Reduction Rate | % | 0 | 0 | 0 | 0 | 90 | 90 | 90 | 90 | 100 | ||
| Category | Detail | Target Year | |
|---|---|---|---|
| Worksites GHG Reduction | Renewable Energy Usage | 23,277 MWh | 2027 |
| Renewable Energy Usage Ratio | 90% | ||
Scope 3 Calculation Results & Management Plan
SK bioscience calculates and continuously manages its Scope 3 GHG emissions in order to reduce them not only from its own business sites but also throughout the entire value chain. To calculate Scope 3 GHG emissions, we have selected the main categories and methodologies in line with domestic and international standards necessary for the calculation. We have identified and collected data such as the cost and quantity of raw materials purchased, fuel usage, and emission factors. Moving forward, we will continuously manage Scope 3 GHG emissions by advancing the template and methodology for data collection and analysis.
The majority of Scope 3 GHG emissions come from category 1 (Purchased Products & Services). Therefore, to reduce GHG emissions in our value chain, we will continue to work with key stakeholders, including intensively managing business partners.
GHG Emission Status : Scope 3
| Category | Emissions (tCO2 eq) | Ratio (%) | |
|---|---|---|---|
| 1 | Purchased Products & Services | 19,488 | 59 |
| 2 | Capital Goods | 401 | 1 |
| 3 | Fuel & Energy | 7 | 0 |
| 4 | Upstream Transportation | 1,574 | 5 |
| 5 | Waste | 656 | 2 |
| 6 | Business Trip | 794 | 2 |
| 7 | Commute | 1,012 | 3 |
| 8 | Lease in | - | - |
| 9 | Downstream Transportation | 1,198 | 4 |
| 10 | Processing | - | - |
| 11 | Product Use | 14 | - |
| 12 | Product Disposal | 7,758 | 24 |
| 13 | Lease Out | - | - |
| 14 | Franchises | - | - |
| 15 | Investments | - | - |
| Total | 32,901 | 100 |